In Part 1, I introduced the problem of metrics aggregations for Ceilometer in OpenStack and how Gnocchi (a time-series database) tries to solve it in a different way. I argued about a possible offloading of work to (Nvida Quadro K620) GPU.
This part summarizes the iterations applied to the kernel (piece of CUDA code, that executes on GPU). It removes the bottlenecks encountered during profiling. To understand this part some background knowledge about programming on GPU would be good. (I recommend reading this or even smaller this)
v1
Based on the discussion in the Implementation section of part 1, I wrote a first version of kernel(v1)
Code:
__global__ void v1(float *a, int *i) {
  int perthread=i[0];
  int counter = i[0]-1;
  int col = blockIdx.x * blockDim.x + threadIdx.x;
  int row = blockIdx.y * blockDim.y + threadIdx.y;
  int index = col * perthread + row;
  for(;counter;counter--)
    atomicAdd(a+index, a[index+counter]);
}
Results :
Simple continuous range
  time to aggregate 17.5399780 msec
  resample(gpu_sum) speed: 2.34 Hz; 427.72102356 msec
  time to aggregate 56.2980175 msec
  resample(cpu_sum) speed: 2.84 Hz; 352.295875549 msec
Just zeros
  time to aggregate 16.6831017 msec
  resample(gpu_sum) speed: 3.20 Hz; 312.555074692 msec
  time to aggregate 56.0901165 msec
  resample(cpu_sum) speed: 2.87 Hz; 348.960161209 msec
Just firing random requests for data from different threads leads to a problem of non-coalesced addressing. Since there is no guarantee of how the scheduler (GPUs have their own scheduler like CPUs) will schedule the warps, the data access patterns from these warps needs to align to achieve maximum throughput of the L2 cache bus. The bandwidth of this bus is device-dependent but mostly it is in multiples of 32 bytes for older GPGPUs and 128 bytes in newer devices.
The data access pattern in the first kernel was not correct. Also getting the pattern correct is a difficult problem. So, I thought of an alternate solution. This required reducing the number of data requests fired but consuming the responses as soon as possible. So each thread did more work, but also created work in a controlled manner.
v2
This is the alternative approach for the kernel(v2).. Here the whole array is divided into chunks and each chunk is refereed as blk
Code:
    __global__ void v2(float *a, int *i) {
    int perthread=i[0];
    int counter = i[0]-1;
    int blklimit=1024;
    int blk=0;
    for (blk=0;blk<blklimit;blk++) {
	    int counter = i[0]-1;
	    int col = blk * blockDim.x + threadIdx.x;
	    int row = blockIdx.y * blockDim.y + threadIdx.y;
	    int index = col * perthread + row;
	    for(;counter;counter--)
	        atomicAdd(a+index, a[index+counter]);
        }
    }
Results:
Simple continuous range
 time to aggregate 21.0869312 msec
 resample(gpu_sum) speed: 2.04 Hz; 490.113973618 msec
 time to aggregate 71.5970993 msec
 resample(cpu_sum) speed: 2.36 Hz; 423.68888855 msec
Just zeros
 time to aggregate 20.2741623 msec
 resample(gpu_sum) speed: 2.67 Hz; 374.500989914 msec
 time to aggregate 72.5300312 msec
 resample(cpu_sum) speed: 2.36 Hz; 424.036026001 ms
All threads from one CUDA-block would chomp upon its own blk. So I had reduced occupancy with less threads. But still generated enough work to keep the threads busy. Also enough read requests to keep the GPU-RAM (Global Memory) read time hidden by overlapping it with work of threads from other warps.
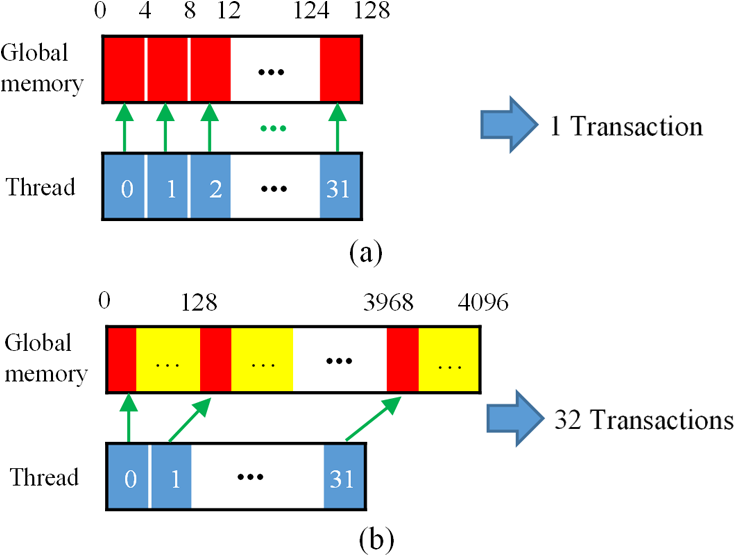
Even the kernel was doing fine here but nvprof was still reporting efficiency issues. One of those was the global-memory access pattern. Since each thread was responsible for aggregating the 6 floats, it would load 6 non-contiguous memory locations. This is a problem in the world of GPUs. As a GPU loads not only one memory location but an entire segment of 128 bytes from global memory into the L2/L1 cache.
So if 32 threads of a warp request 4 bytes(float) from non-contiguous locations, the GPU would get request for locations that are 24(6*4) bytes apart form each thread in a warp, resulting into 768 (24*32) bytes, falling into 6 (768/128) segments. But since there is only one bus there will be request serialization stalling the warp
This is a huge waste of bandwidth as only 24 bytes out of 768 bytes are actually used. There are many ways to circumvent this problem and thus lead to the next iteration.
v3
Code:
    __global__ void v3(float *a, int *i) {
    int perthread=i[0];
    int gridsize = 4*4;
    int blklimit=1024/gridsize;
    int blk=1;
    int row, col, index;
    __shared__ float inter[6*1024/16];
    int counter = 0;
    for (blk=1;blk<blklimit;blk++) {
	    counter = perthread-1;
	    col = blockIdx.x * blockDim.x + threadIdx.x + blockDim.x*blk*perthread;
	    row = blockIdx.y * blockDim.y + threadIdx.y;
	    int tid = threadIdx.x;
	    for(counter=0;counter<perthread;counter++){
		    index = col + blockDim.x*counter + row;
		    inter[blockDim.x * counter + tid] = a[index];
	    }
	    __syncthreads();
	    counter = perthread-1;
	    int x = 0;
	    for(;counter;counter--){
		    x += inter[blockDim.x * counter + tid];
	    }
	    a[index] = x;
        __syncthreads();
	}
 }
Results:
Simple continuous range
  time to aggregate 14.5051479
  resample(gpu_sum) speed: 1.96 Hz
  time to aggregate 75.1349926
  resample(cpu_sum) speed: 2.26 Hz
Just Zeros
  time to aggregate 14.0569210
  resample(gpu_sum) speed: 2.62 Hz
  time to aggregate 74.8288631
  resample(cpu_sum) speed: 2.25 Hz
V3 is more “static” because I wrote it to test out things. I call it static because all the numerics involved are precomputed and the kernel will fail with even even a small change in input or blocks size or grid size.
It uses shared memory. CUDA compiler manages the shared memory allocation per block. So shared memory allocated for block X is not accessible to the threads of block Y. So any writes from threads of block X are visible only to threads of block X. Shared Memory has one other advantage. It is much faster than global memory, and it does not suffers from the addressing coalescing issue as faced by global memory.
So the approach here was to load all the data required into the shared memory using adjoining threads to load adjoining locations from global memory. Once the shared memory is completely populated (as forced by the __syncthreads call) each thread can go ahead do its aggregations (sum). Here I have still used the similar concept of blks from v2 as the shared memory is sized in few kilobytes and not in gigabytes like the global memory and therefor needs to used conservatively.
This was a good improvement over v2 and nvprof did not report any major efficiency issues with the kernel. But this did not fit well in the whole solution, because the ratio of time(work-done):time(waiting-to-begin-work) was very bad.
The picture (execution timeline from Nvdia Visual Proflier) shows a classic problem in case of GPUs. In general there is nothing much to do about it. As you can see most of the time the GPU is siting idle doing only memory copy between CPU and GPU.
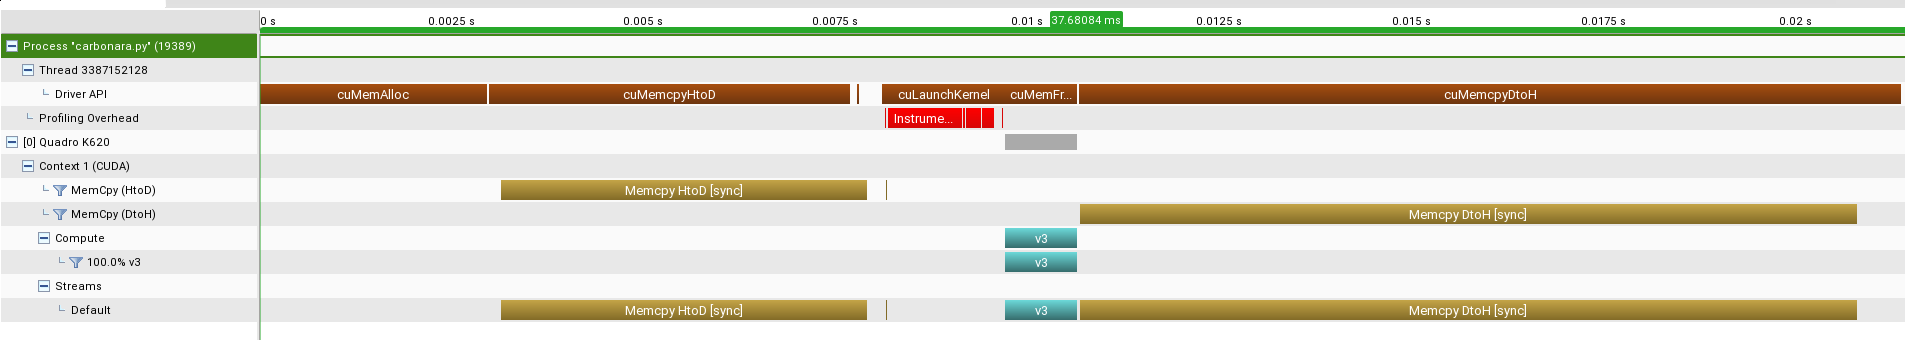
 - Magenta Color               : API call from CPU  to GPU like memalloc, memcpy etc
 - Golden Color                : Memory copy(Memcpy)
 - Dark Cyan Color(v1,v2,v3,v4): Actual kernel execution (computation) on GPU
 - HtoD                        : CPU-RAM to GPU-RAM
 - DtoH                        : GPU-RAM to CPU-RAM
 - Sync                       : Blocking Call; CPU will wait till the GPU is Done
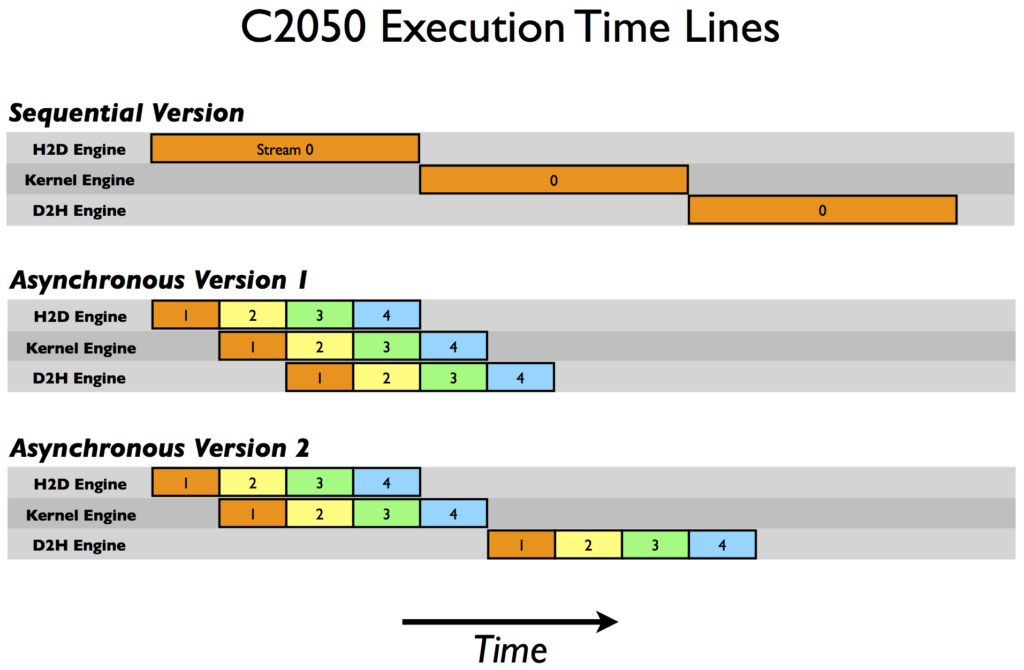
In most cases the suggestion is to use Streams. Streams are “threads” to GPUs what “threads” are to CPUs. Streams are also more like pipelines where the CPU can push work to the GPU and the work will get picked up whenever resources are available. Streams have one more advantage, they run in parallel, the GPU can process work from different streams independently. This property is useful to do compute and memcpy (between host and GPU memory) asynchronously. Since the GPU has different memory and compute engines, these two operations can be overlapped in different streams.
In the next part I will talk about the final iteration and kernel for other parts of the library. I also present my learning and conclusion from this experiment.