In Part 2, I summarized the iterations applied to the kernel (the piece of CUDA code that executes on GPU) to remove the bottlenecks encountered during profiling, like using shared memory to avoid non-coalesced memory access. In this part, I will talk about the final version of the kernel and using the GPU in other parts of the library.
v4
Using streams to speed up the whole calculation I created v4. It divides up the work of copying data across streams and then fires compute kernels on GPU with appropriate arguments. There was some speed up and aggregation took ~4 msec or 4000 microsec less than the that of v3.
Code:
            __global__ void v4(float *data, int *i, float *output) {
              int perthread=7;
              int blklimit=128;
              int blk=1;
              int row, col, index;
              extern __shared__ float inter[];
              int counter = 0;
              for (blk=0;blk<blklimit;blk++) {
                  counter = perthread-1;
                  col = blockIdx.x * blockDim.x + threadIdx.x + blockDim.x*blk*perthread;
                  row = blockIdx.y * blockDim.y + threadIdx.y;
                  int tid = threadIdx.x;
                  for(counter=0;counter<perthread;counter++){
                      index = col + blockDim.x*counter + row;
                      inter[blockDim.x * counter + tid] = data[index];
                  }
                  __syncthreads();

                  int x = 0;
                  for(counter=0;counter<perthread;counter++){
                      x += inter[blockDim.x * counter + tid];
                  }
                  index = col + row;
                  output[tid] = x;
                  __syncthreads();

              }
            }
Result:
Simple continuous range
  time to aggregate 10.4160309 msec
  resample(gpu_sum) speed: 1.84 Hz
  time to aggregate 79.3750286 msec
  resample(cpu_sum) speed: 1.91 Hz
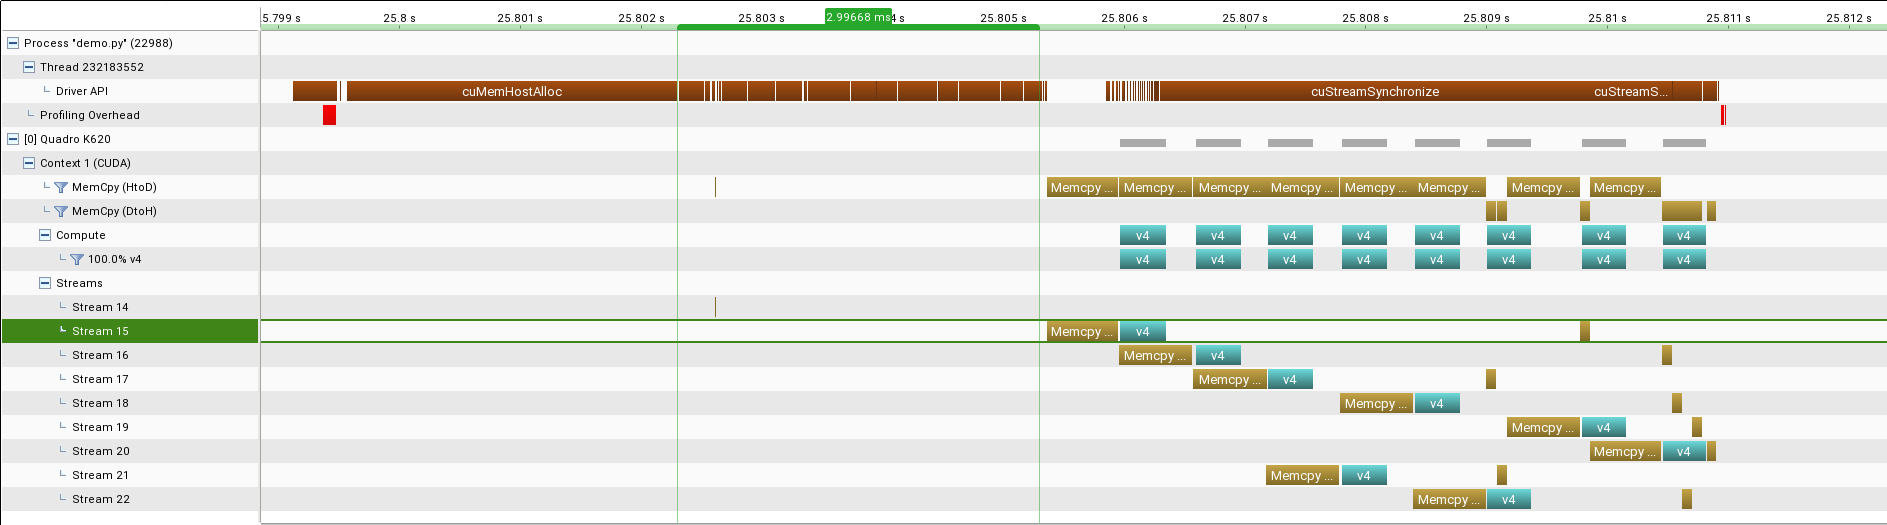
- Magenta Color               : API call from CPU  to GPU like memalloc, memcpy etc
- Golden Color                : Memory copy(Memcpy)
- Dark Cyan Color(v1,v2,v3,v4): Actual kernel execution (computation) on GPU
- HtoD                        : CPU-RAM to GPU-RAM
- DtoH                        : GPU-RAM to CPU-RAM
- Sync                       : Blocking Call; CPU will wait till the GPU is Done
So instead of using blks for dividing the data, I used streams and each block performed aggregations over only a part of the data. But from the timeline it was clear that there were still more optimizations possible. For example using a big memalloc as an array and share parts of it across streams. This was already an improvement.
But if one looked at the whole picture, the new versions were getting more complicated for no real benefit in performance.
One way I looked at reducing the time required to memcpy was utilizing the bus between CPU and GPU. There is a possibility that the PCIe bus was underutilized and by launching memcpy from different threads this could be improved. However that was not the case, my CPU has a PCIe3 x16 bus and according to this link it was capable of doing at least 16GB/s but the GPU (Quadro K620) has PCIe2 x16 bus thus limiting the mempcy speed.
I made some more optimizations like that of compiling the kernel code at load time, assuming a real world scenario would (hopefully) not require rewriting the kernel. Later I removed the use of jinja as compiling those templates was as slow as 130 msec, even the kernel execution was faster than that.
So leaving the code as it is I turned to other parts of the library which could be "Gpu"ed to gain benefits and for this I choose the v3 kernel to begin with as that was simple and yet not too simple.
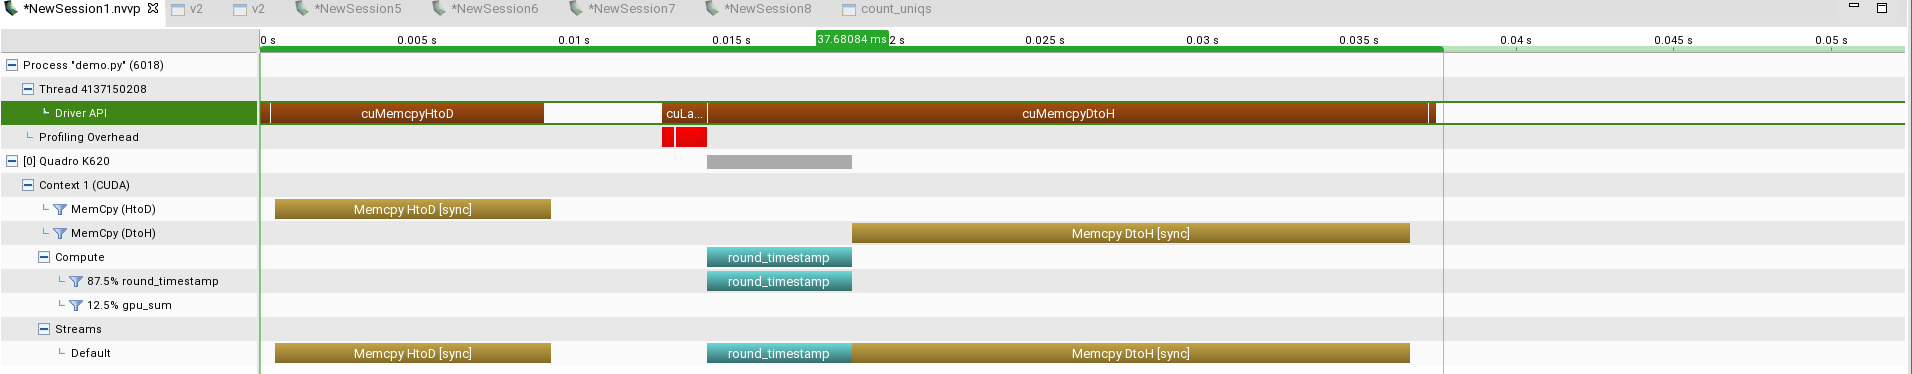
round_timestamps
round_timestamps was the easiest of all because each thread could operate on individual data and there was no complicated math to be done. So each numpy.datetime64[ns] could be represented by an unsigned long long on the GPU and a floor operation was nothing but an integer division. The result is written over input array so no extra allocation was required. Perf analysis for round_timestamps
     __global__ void round_timestamp(unsigned long long *a, unsigned long long freq) {
	    int col;
        unsigned long long UNIX_UNIVERSAL_START64={UNIX_UNIVERSAL_START64};
        col = blockIdx.x * blockDim.x + threadIdx.x;
        a[col] = (UNIX_UNIVERSAL_START64 + ((a[col] - UNIX_UNIVERSAL_START64) / freq) * freq);
    }
count_uniqs(diff)
So far everything was fine and I still have a speed-up of 4× with a naive implementation. But the kernel so far has been relying on one assumption of resample-factor. This resample-factor is what the code calls reduce_by. When aggregating sample spaced at 5s interval to 35s interval it easy to calculate 7(35/5). I had hard-coded this 7 into the kernel, the kernel launch parameters, and also in shared memory size calculations.
However this will not be the case in the real world and an algorithm was needed to calculate this resample-factor. Calculating this number is not easy. There could be cases where the measurements are available at 7s intervals and requiring aggregation into 13s interval or 55s interval or even 300s interval. On top of this there could be “timegaps” when no data is available.
So to count which specific intervals should be aggregated together. I implemented the following algorithm in the kernel count_uniqs
- if timestamps
t(from round_timestamps) at positionnis not same as that atn-1:- then the thread
Tis thefirstone in series oftfromn; and should bemarked
- then the thread
- only
marked thread should continue counting followingt's and stop on encountering something other thant.
This way at the end each marked thread will have the count of uniqs that of each timestamp that exists.
This kernel had many efficiency issues, the first being the non-coalesced memory access. The second was due to the divergent nature of the kernel many warps would be less efficient. In some cases this divergence could lead to serialization of “if-else-halfs” (the link has a better explanation).
Yet even with such a naive implementation the benchmark was fast and could beat the CPU benchmark.
Next step was to link the two kernel (count_uniqs and v3) together and get the final results.
But after some thought I found that count_uniqs kernel could also do the aggregation as it was already picking the unique timestamps. Thus with some modifications the kernel was able to do both and the kernel (v3) was no longer required.
I made other small optimizations which turned out as learning:
- there is no need to copy result of
round_timestampsback to host memory ascount_uniqscould reuse it - aggregation was a by-product of
count_uniqsand so can be other methods of aggregation thus helping to hide latency introduced while copying data to/from GPU
Conclusion
Computing on GPU demands intense workloads. This helps to hide the memcpy latency. In case of applications like Gnocchi, Ceilometer-Api and maybe Monasca, if I apply this condition, it is better to do the aggregation when requested rather than on receipt. This is because the amount of data received (for pre-computing) at any moment will always be small in quantity, as compared to already stored data.
For example:
    @5s interval for 30 days  < data size analysed in code
           1.3 million points < 1024*1024*6 points
And in all cases the GPU turned out to be better than the CPU. So if there existed a hypothetical library with such functionality which could do exactly what these applications required then they all could benefit from it. Such a library would be capable of doing basic aggregations, and also provide an easy interface to write strong abstractions converting into GPU code, to have custom aggregate functions.
One might argue that there are already many open source libraries which are capable of pushing computation to the GPU, but one of the important lessons from this experiment was:
Writing CUDA code is very domain specific and coming up with a generic solution will require a lot of engineering.
This engineering is required to shape the solution to the specific needs of the application.
It would help to create such a library if many applications belonging to the same OpenSource Domain can benefit.
But for that to happen one project will have to walk the path and demonstrably set an example for others to follow. I recommend Gnocchi as that project.